2023 Year-End Report
The District ended Calendar Year 2023 with 3540 calls for service, of which *most* were EMS/Medical Aids. To see the rest of the annual stats for 2023, please check out the stat pages and the gallery of a few of our larger incidents below:

.jpg?ixlib=rb-1.1.0&w=2000&h=2000&fit=max&or=0&s=43c85d80dd61872bf980f32a452c3d4e)
.png?ixlib=rb-1.1.0&w=2000&h=2000&fit=max&or=0&s=8fd11268e0fa2fbcc799871ef8f1aece)
.jpg?ixlib=rb-1.1.0&w=2000&h=2000&fit=max&or=0&s=0335ef32d4df3bfc8e5d85ad9761e137)
.jpg?ixlib=rb-1.1.0&w=2000&h=2000&fit=max&or=0&s=6a66237f1a67c672bc82d4fee0db01ad)
.jpg?ixlib=rb-1.1.0&w=2000&h=2000&fit=max&or=0&s=1241cc98231c4ed6a16bd6141374add4)
.jpg?ixlib=rb-1.1.0&w=2000&h=2000&fit=max&or=0&s=929bd9d0a9e825435519fd926ee88a84)
.jpg?ixlib=rb-1.1.0&w=2000&h=2000&fit=max&or=0&s=edd3e505ae3511a5afc98080527f28f6)
.jpg?ixlib=rb-1.1.0&w=2000&h=2000&fit=max&or=0&s=21b5e4f86b876071520f6f8b3ddb97b2)
.jpg?ixlib=rb-1.1.0&w=2000&h=2000&fit=max&or=0&s=156bb2febd28859e86f3e3a442d7a5c4)
Larger-scale incident gallery below:

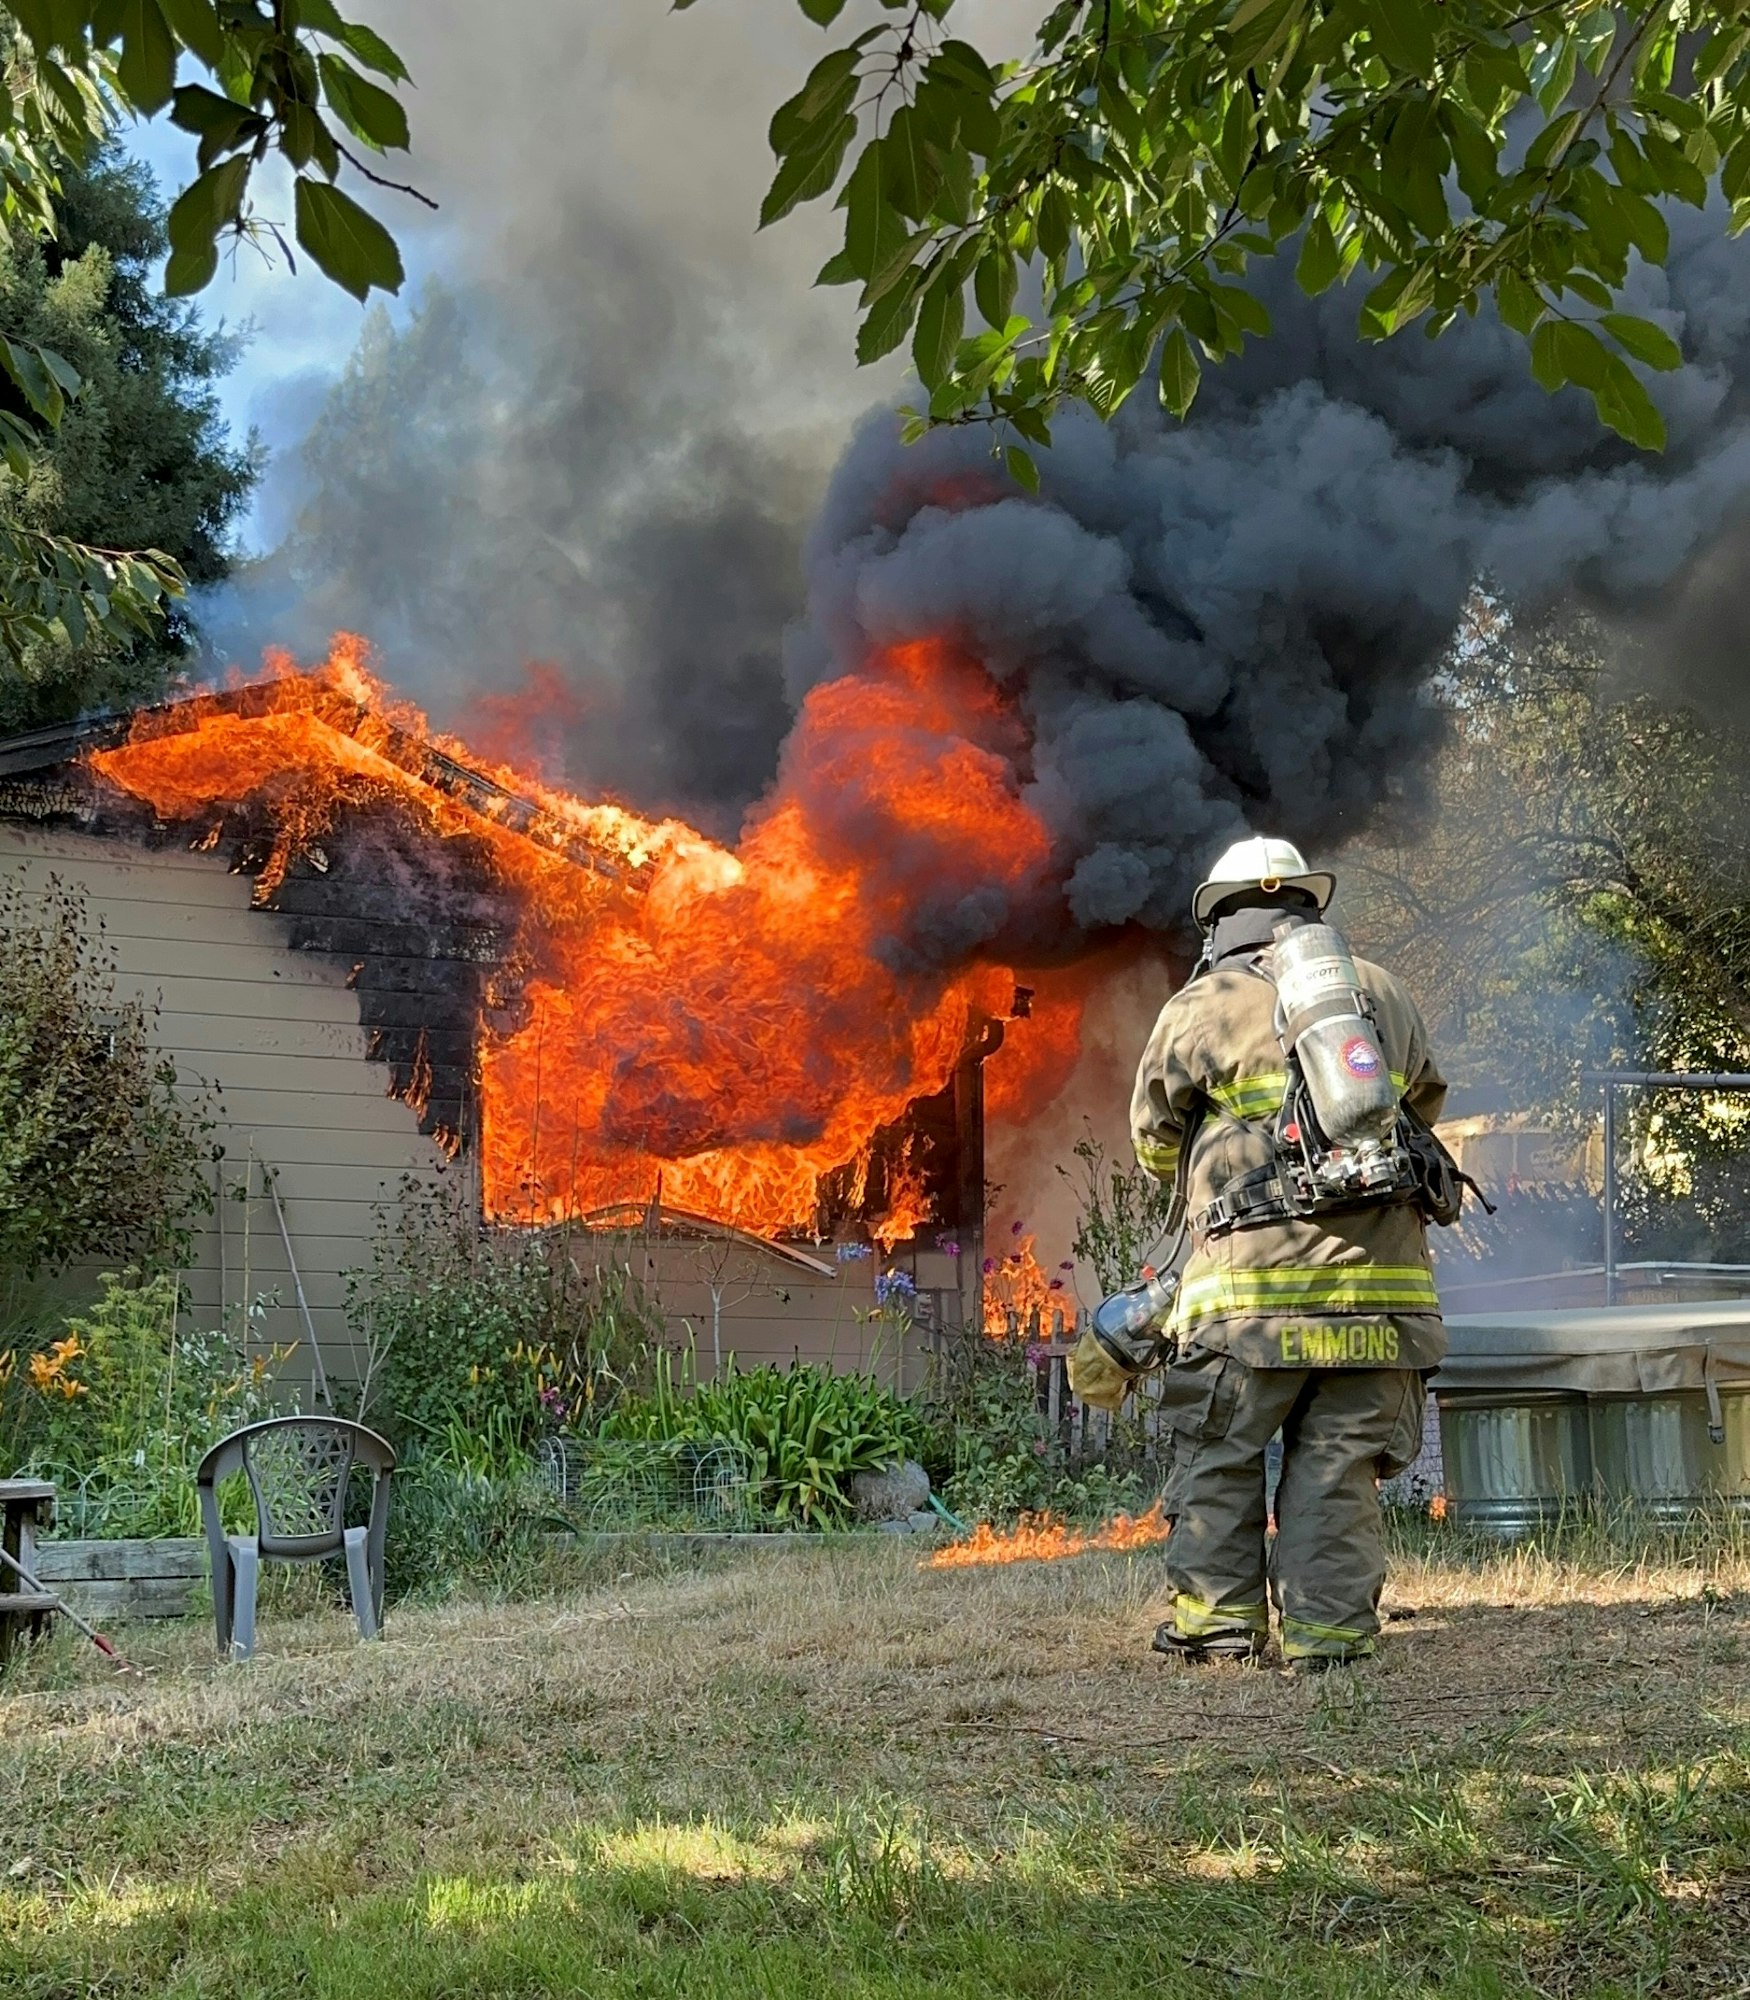
Assistant Chief Chris Emmons in front of the Blue Lake residential structure fire incident.

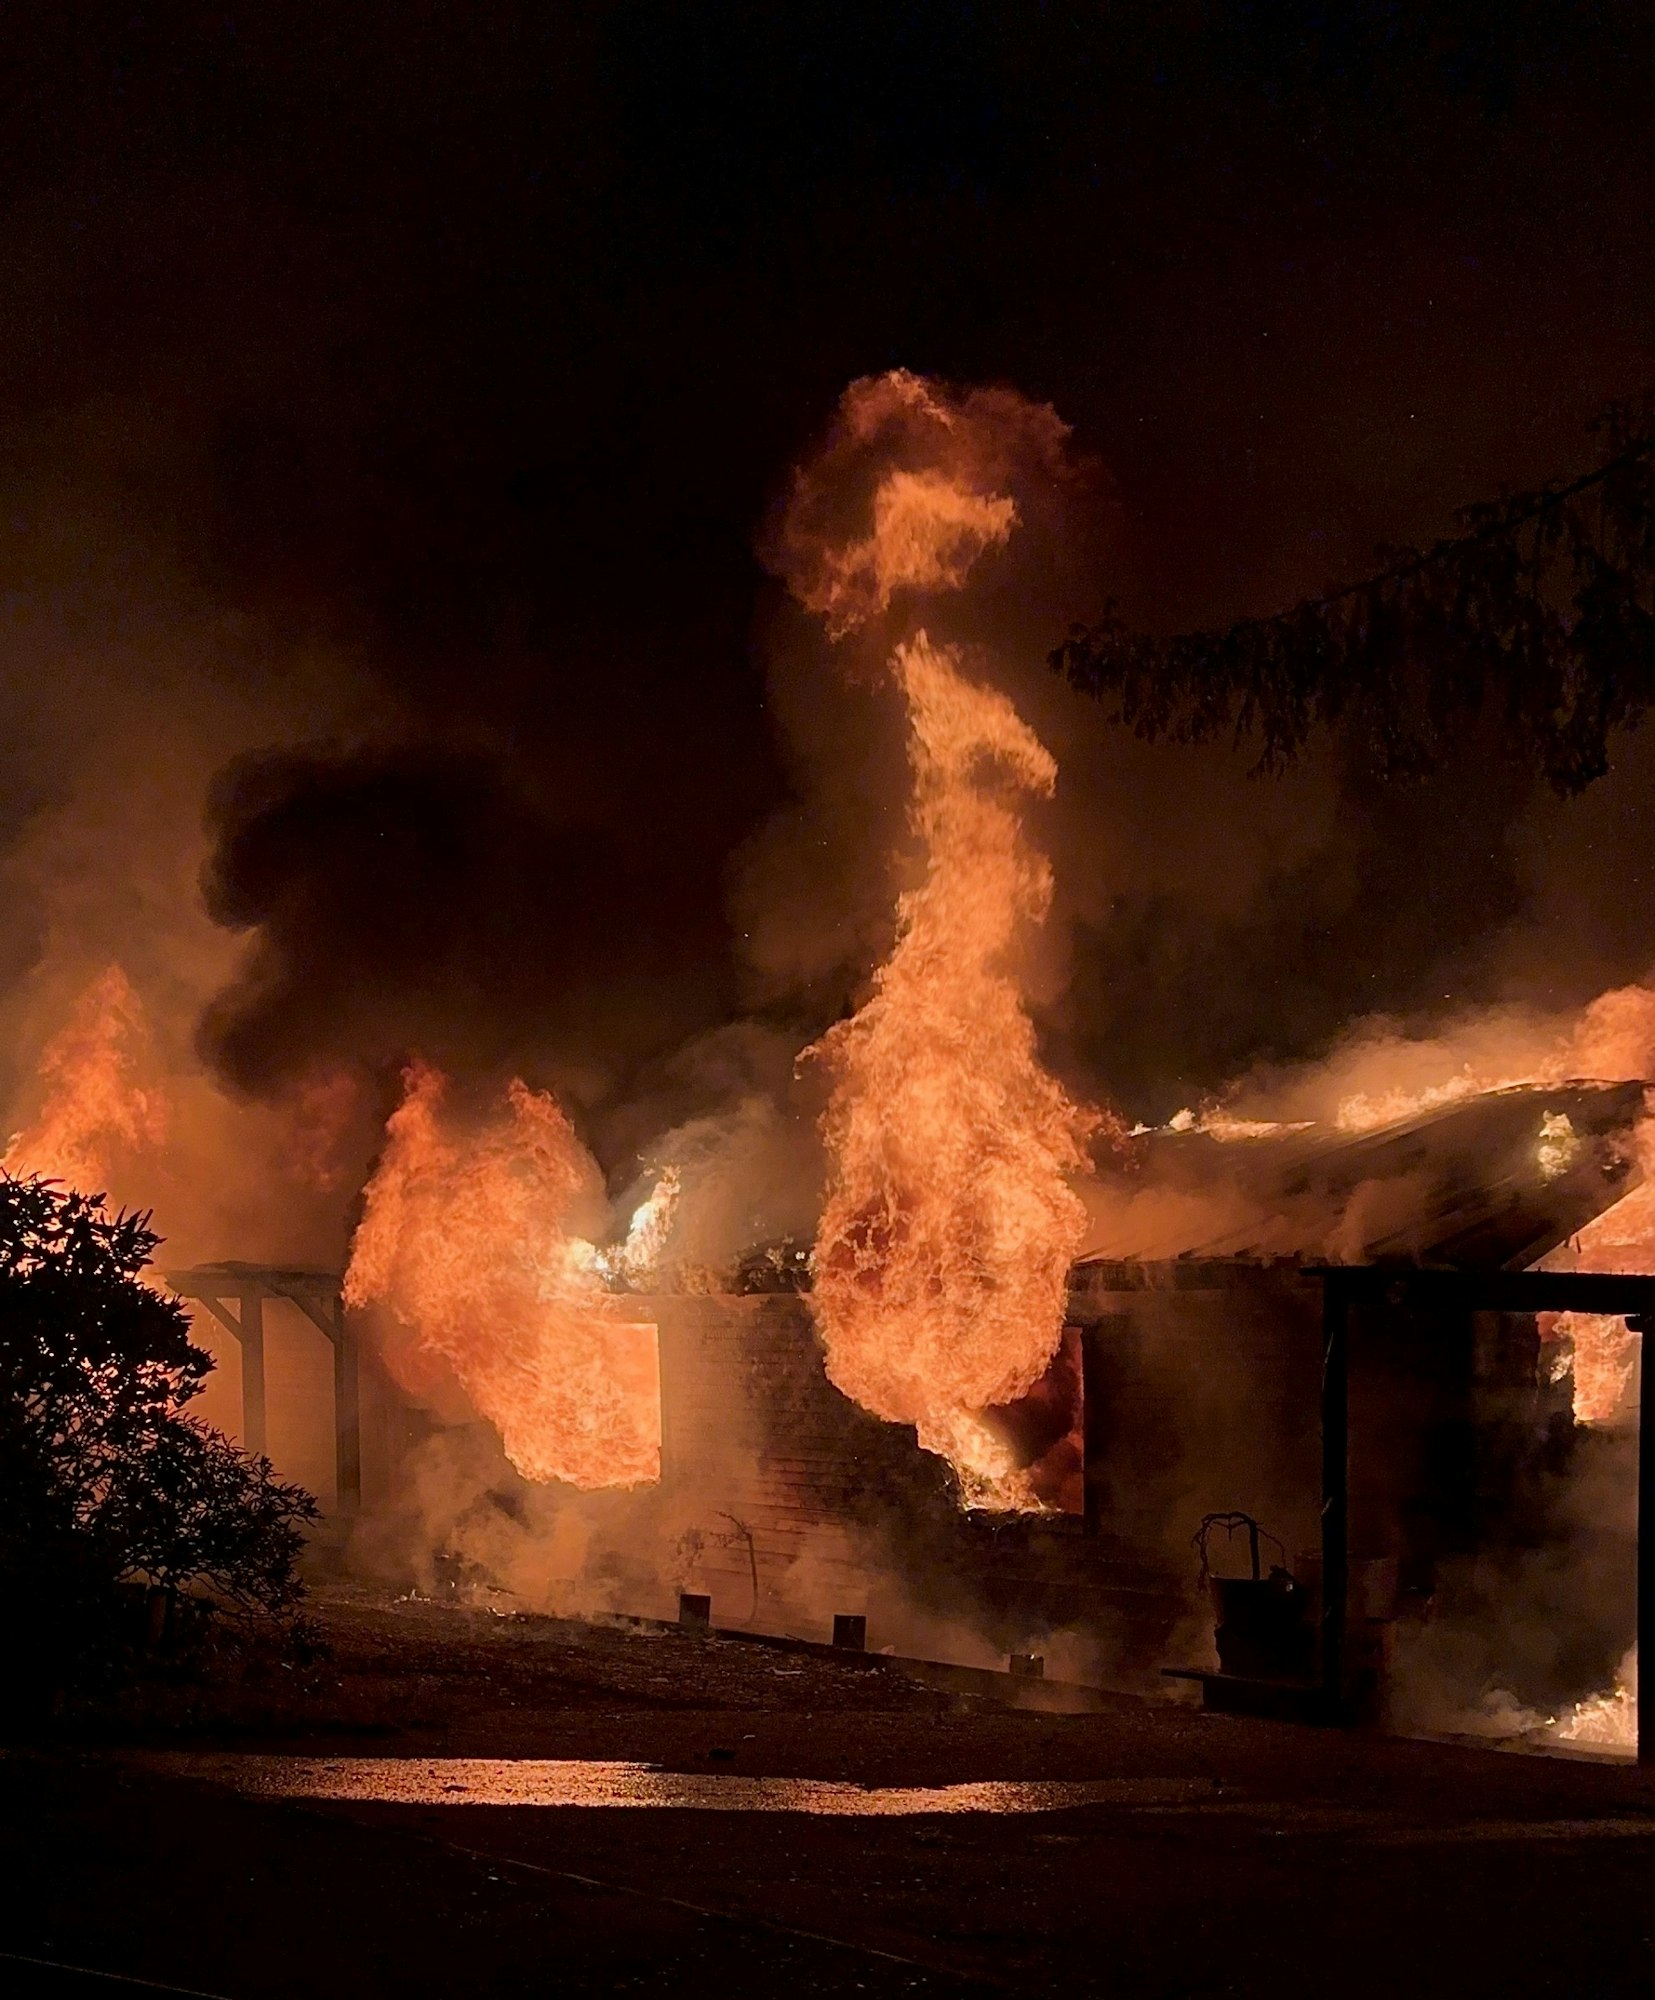
Fickle Hill residential structure fire incident.

Bayside Porche fire incident.

McKinleyville wildland fire incident.

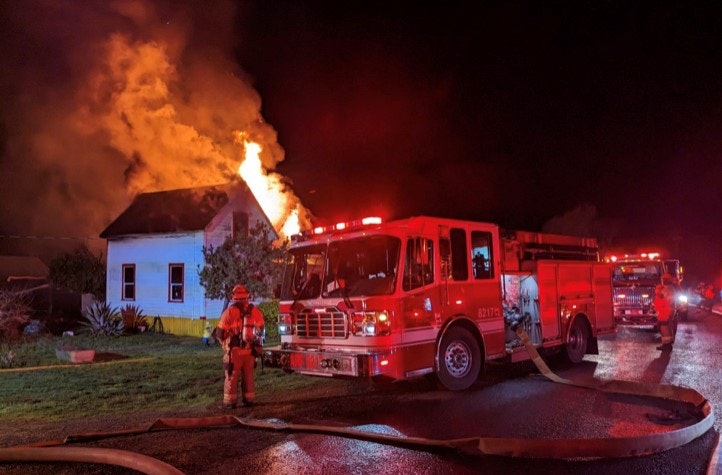
West End Ct. residential structure fire incident.

Redwood tree on fire from suspected arson.

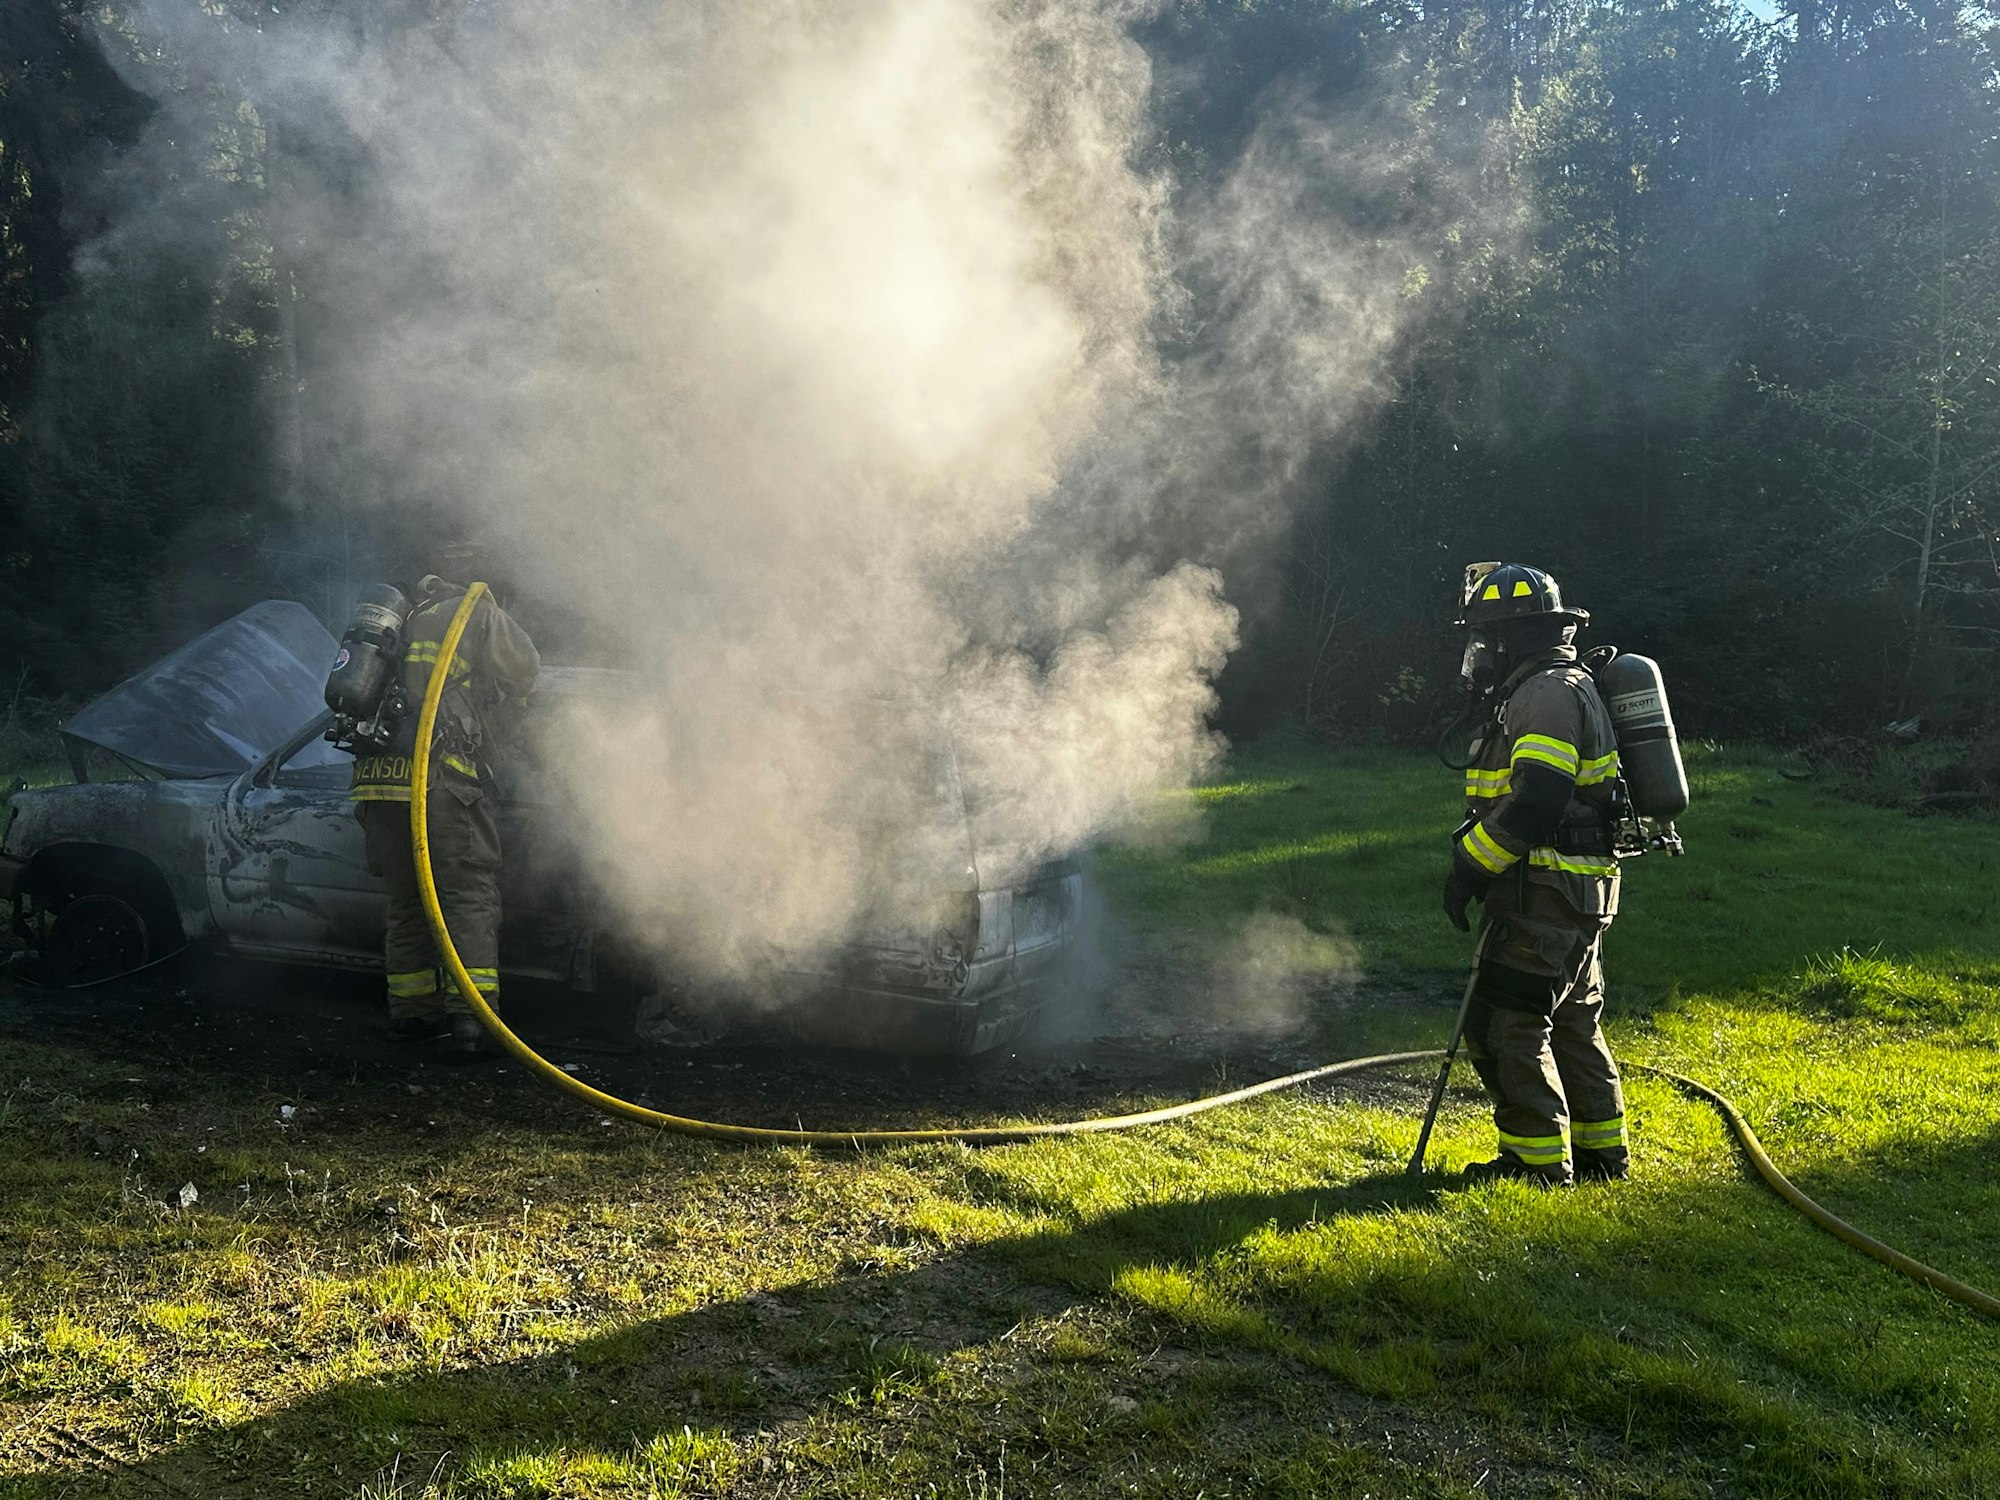
Vehicle fire on Idylbear.

Blue Lake structure fire.


