The District ended Calendar Year 2023 with 3540 calls for service, of which *most* were EMS/Medical Aids. To see the rest of the annual stats for 2023, please check out the stat pages and the gallery of a few of our larger incidents below:
Larger-scale incident gallery below:
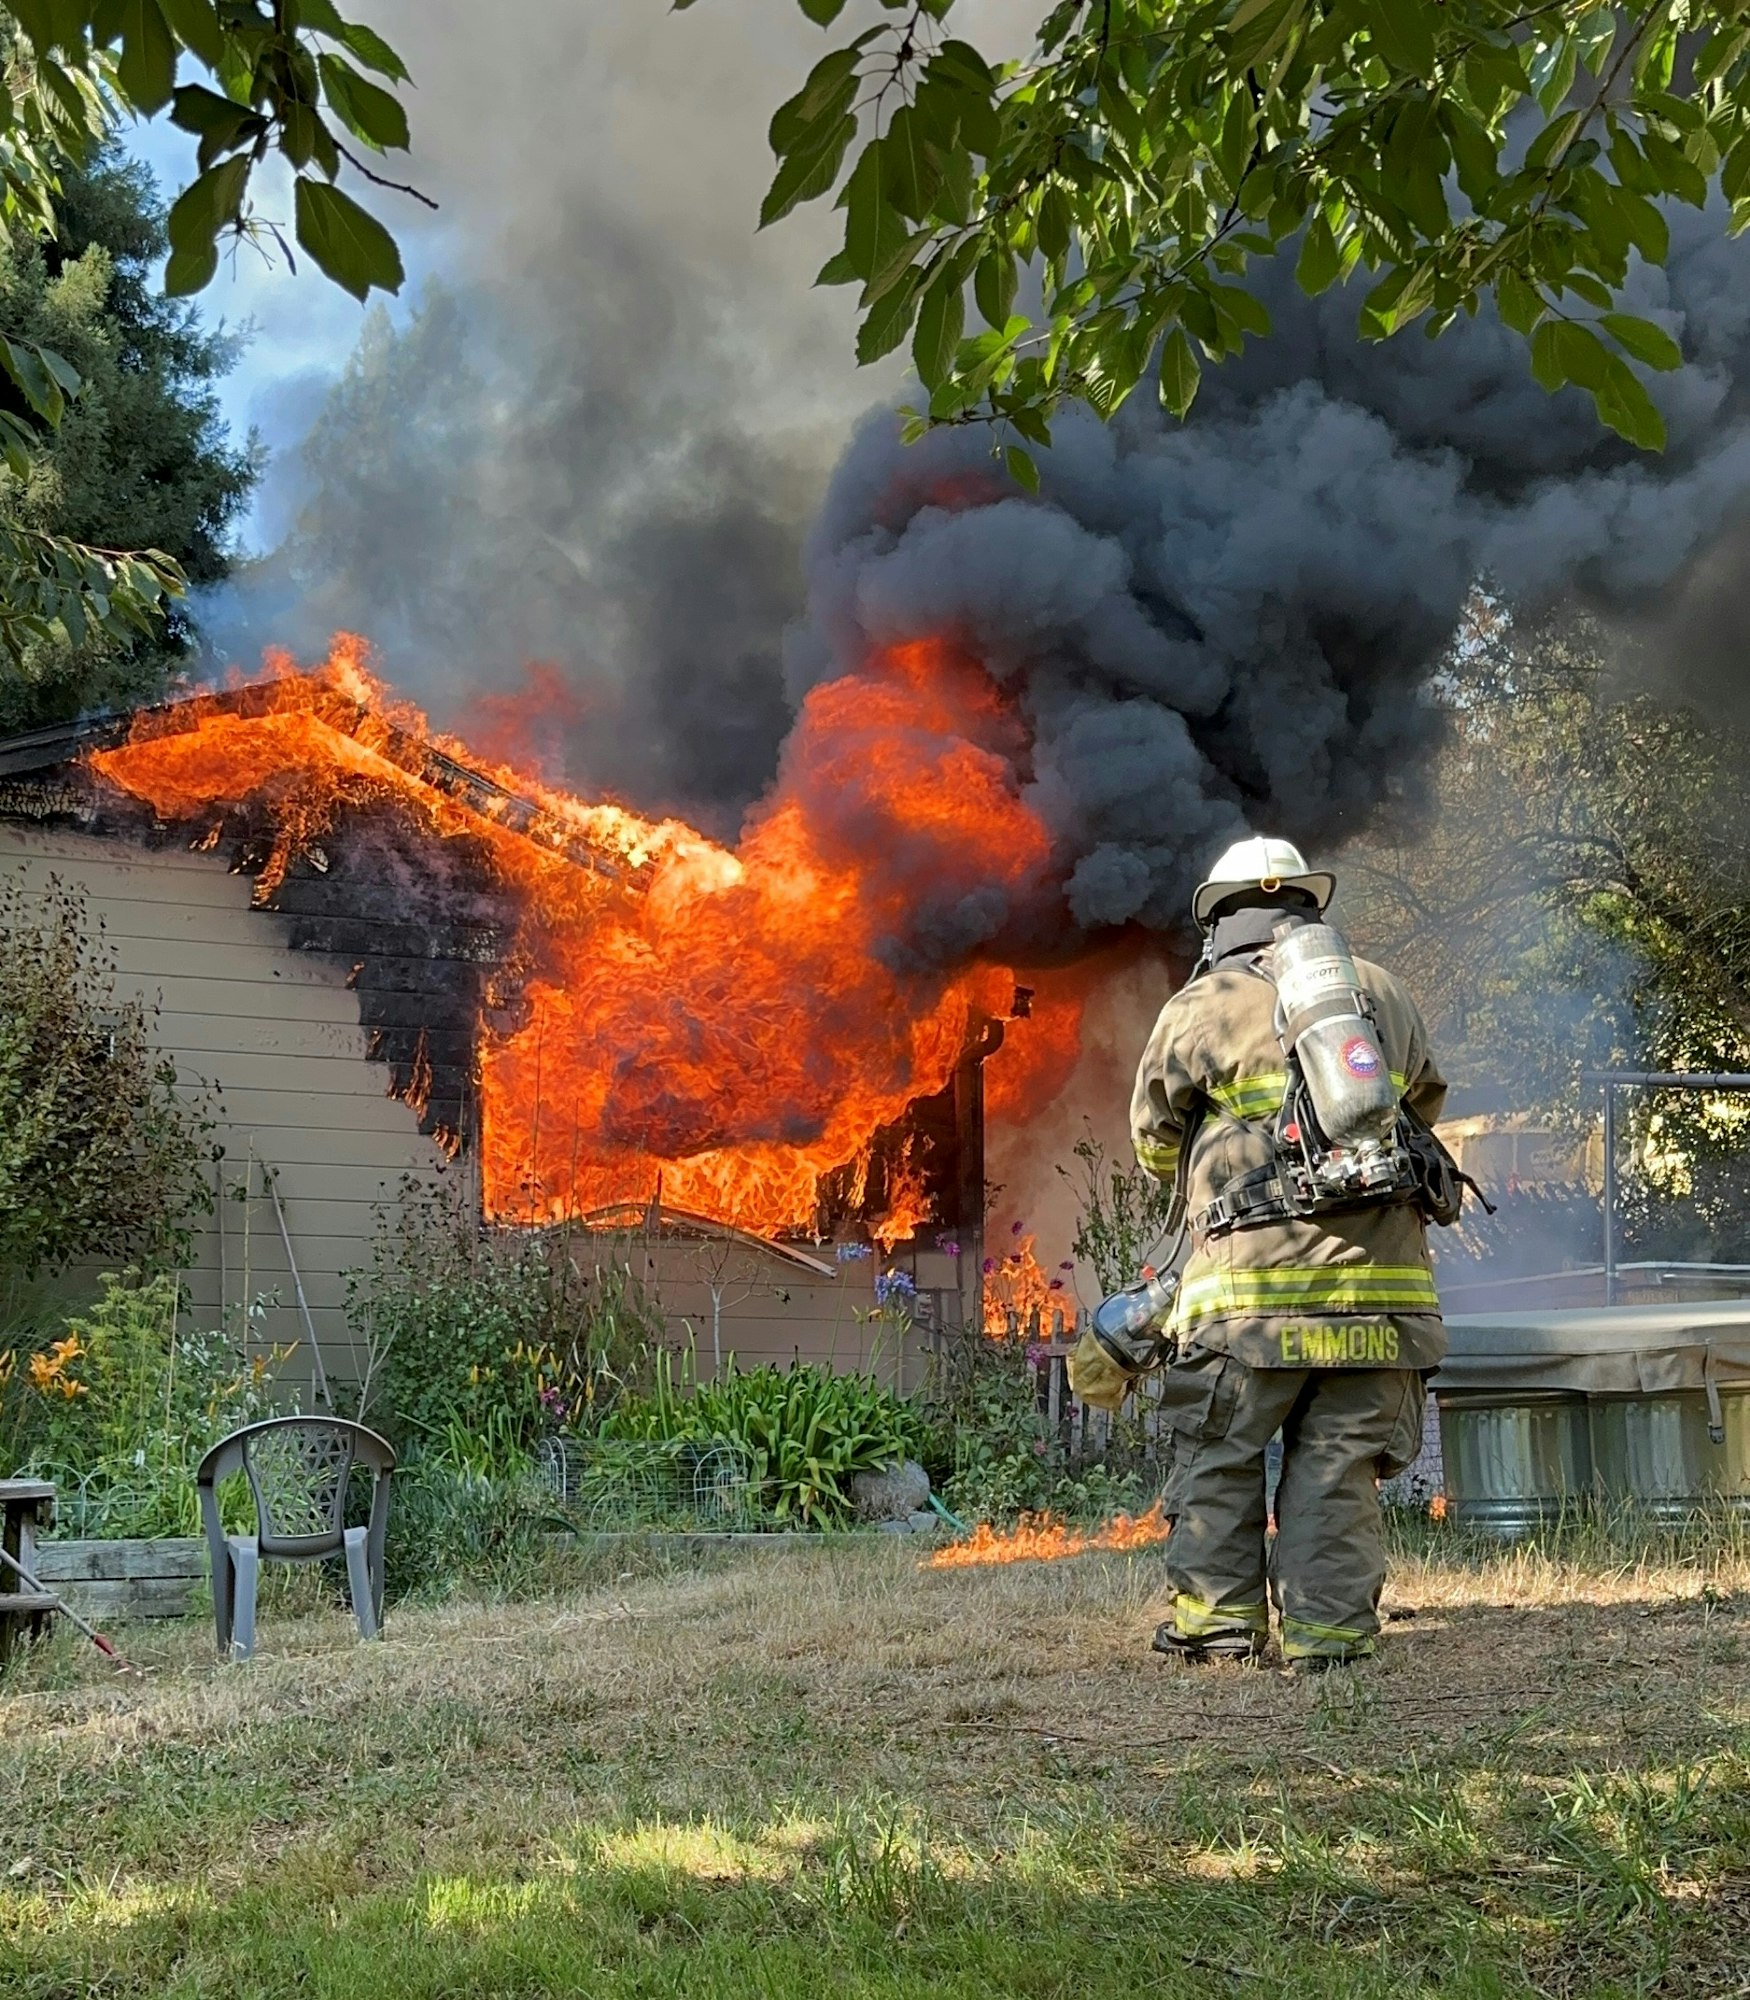
Assistant Chief Chris Emmons in front of the Blue Lake residential structure fire incident.
Fickle Hill residential structure fire incident.
Bayside Porche fire incident.
McKinleyville wildland fire incident.
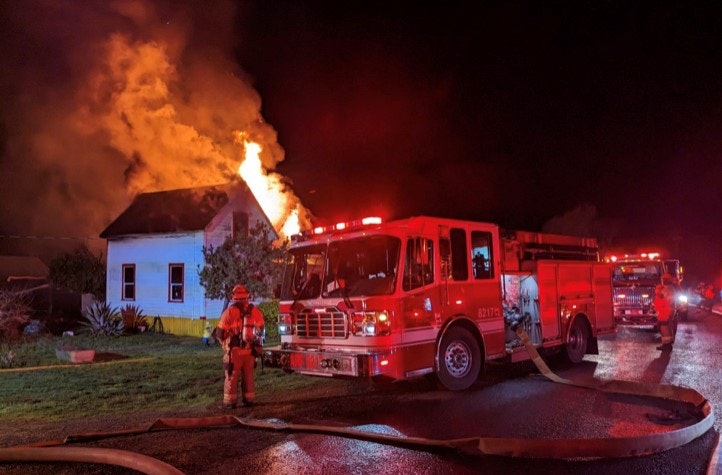
West End Ct. residential structure fire incident.
Redwood tree on fire from suspected arson.
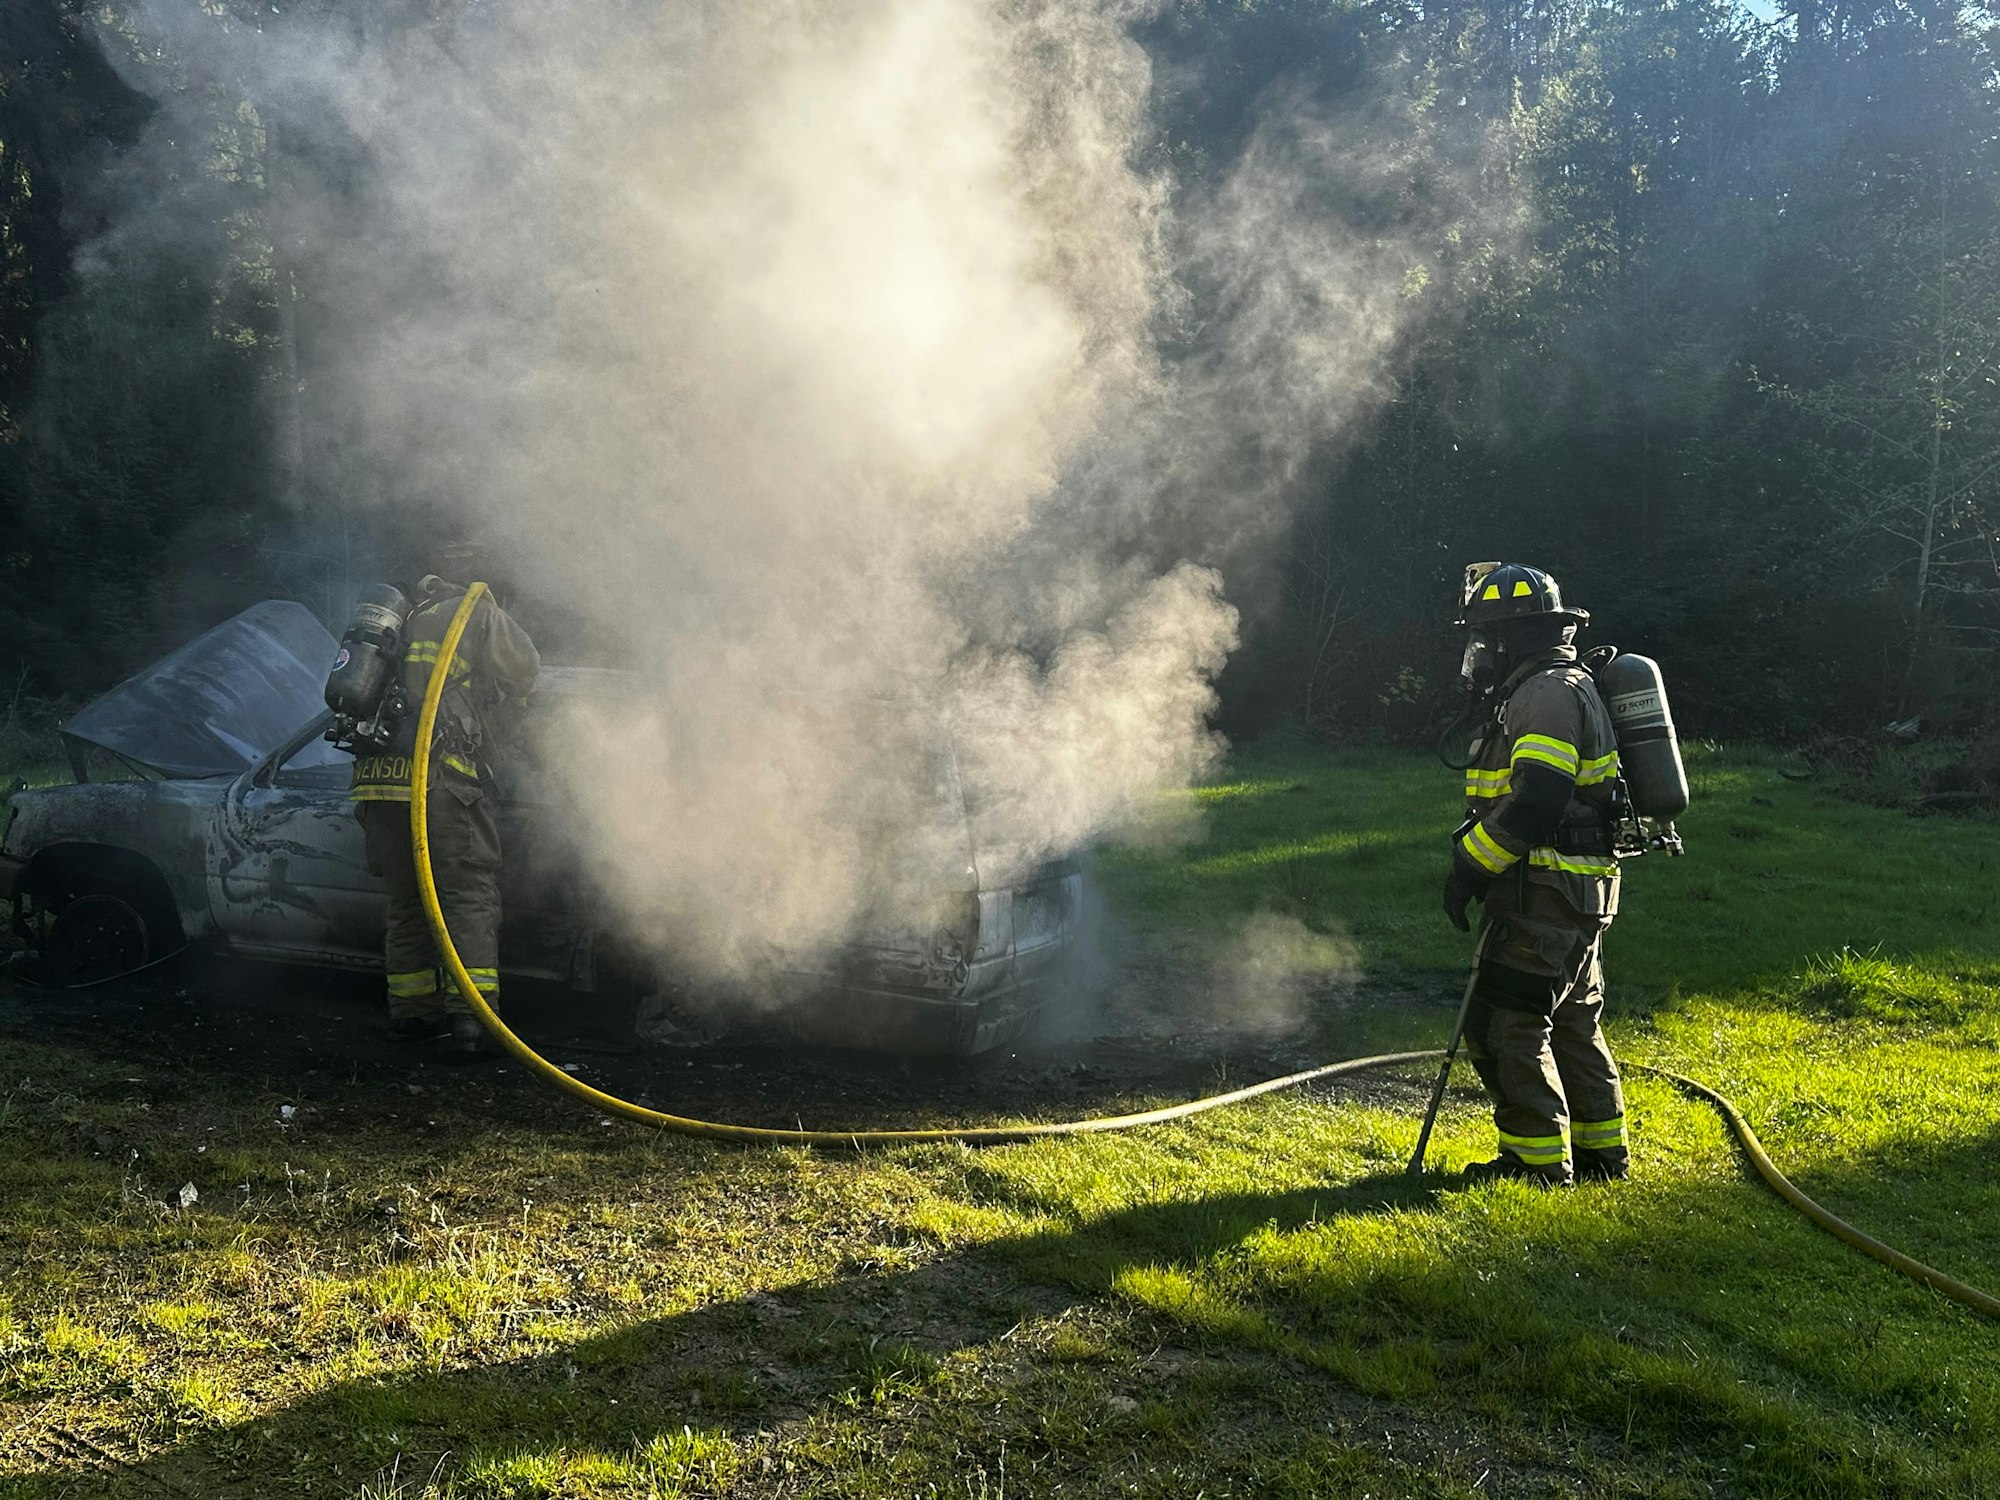
Vehicle fire on Idylbear.
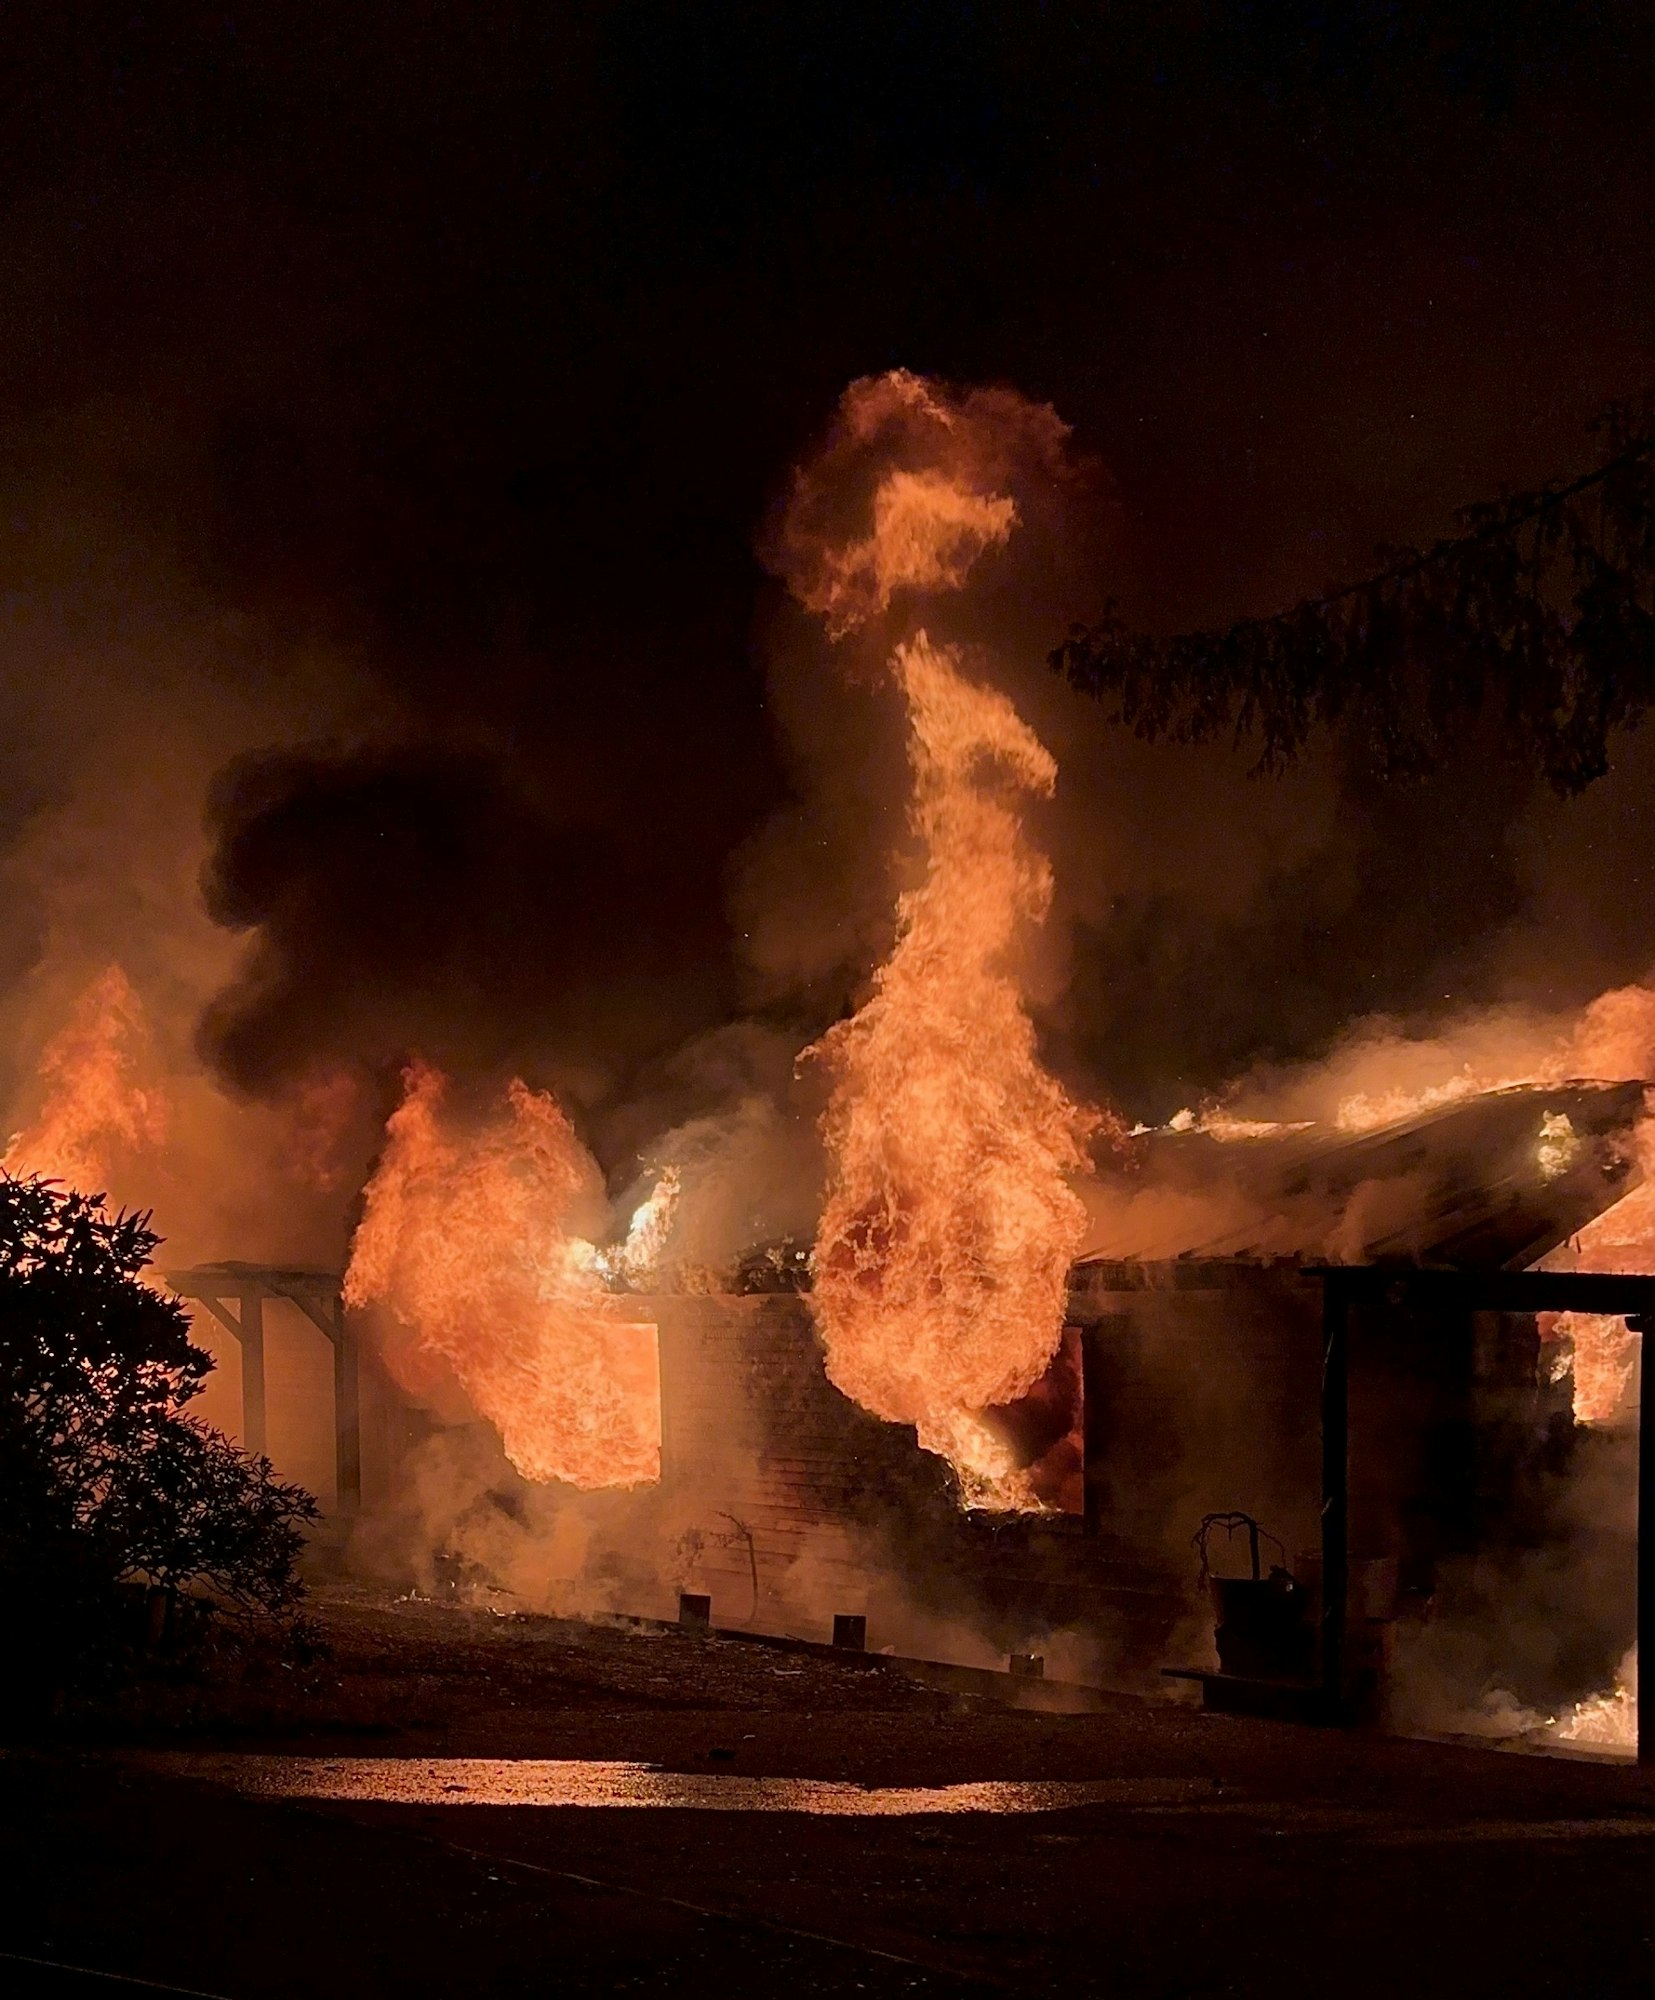
Blue Lake structure fire.
Sign up for updates from Arcata Fire District
Thanks for signing up!
There was an error saving your request. Please make sure you entered a valid email.
Arcata Fire District is fully committed to providing accessible facilities, elements and
channels of communication to all members of the public. As part of this commitment, Arcata Fire District
has a policy of providing an accessible website compatible with the Web Content Accessibility Guidelines (WCAG 2.1) and
commercial screen reading software. All features of the website are coded to allow individuals with vision and
other impairments to understand and use the website to the same degree as someone without disabilities. We welcome
feedback and can often resolve issues in a timely manner if they arise.
If you need any special assistance or accommodations:
Arcata Fire District has designated a compliance officer for website disability-related accommodations.
The compliance officer has received training in website accessibility and updates the site in accordance with those best
practices. Contact our accessibility officer to report an issue.
Compliance Procedures and Reports
In addition to testing with users with a wide range of disabilities and coding our website to WCAG standards,
Arcata Fire District regularly scans its website to ensure ongoing compliance, and makes timely
changes to any inaccessible changes, if any are found.
Linked Documents and Third Parties
Please note that this site may link out to third-party websites, such as state or federal agencies, that do
not have accessible content. This site may also include documents provided by third parties included in our
agenda packets, for example. While we cannot control the accessibility of content provided by third parties,
we are happy to assist any member of the public with reading and accessing content on our site.


.jpg?ixlib=rb-1.1.0&w=2000&h=2000&fit=max&or=0&s=43c85d80dd61872bf980f32a452c3d4e)
.png?ixlib=rb-1.1.0&w=2000&h=2000&fit=max&or=0&s=8fd11268e0fa2fbcc799871ef8f1aece)
.jpg?ixlib=rb-1.1.0&w=2000&h=2000&fit=max&or=0&s=0335ef32d4df3bfc8e5d85ad9761e137)
.jpg?ixlib=rb-1.1.0&w=2000&h=2000&fit=max&or=0&s=6a66237f1a67c672bc82d4fee0db01ad)
.jpg?ixlib=rb-1.1.0&w=2000&h=2000&fit=max&or=0&s=1241cc98231c4ed6a16bd6141374add4)
.jpg?ixlib=rb-1.1.0&w=2000&h=2000&fit=max&or=0&s=929bd9d0a9e825435519fd926ee88a84)
.jpg?ixlib=rb-1.1.0&w=2000&h=2000&fit=max&or=0&s=edd3e505ae3511a5afc98080527f28f6)
.jpg?ixlib=rb-1.1.0&w=2000&h=2000&fit=max&or=0&s=21b5e4f86b876071520f6f8b3ddb97b2)
.jpg?ixlib=rb-1.1.0&w=2000&h=2000&fit=max&or=0&s=156bb2febd28859e86f3e3a442d7a5c4)